MEPS 597:191-206 Supplementary Material
Spatial ecology of Carcharias taurus in the northwestern Mid-Atlantic coastal ocean
MEPS 597:191-206 | Full text in pdf format

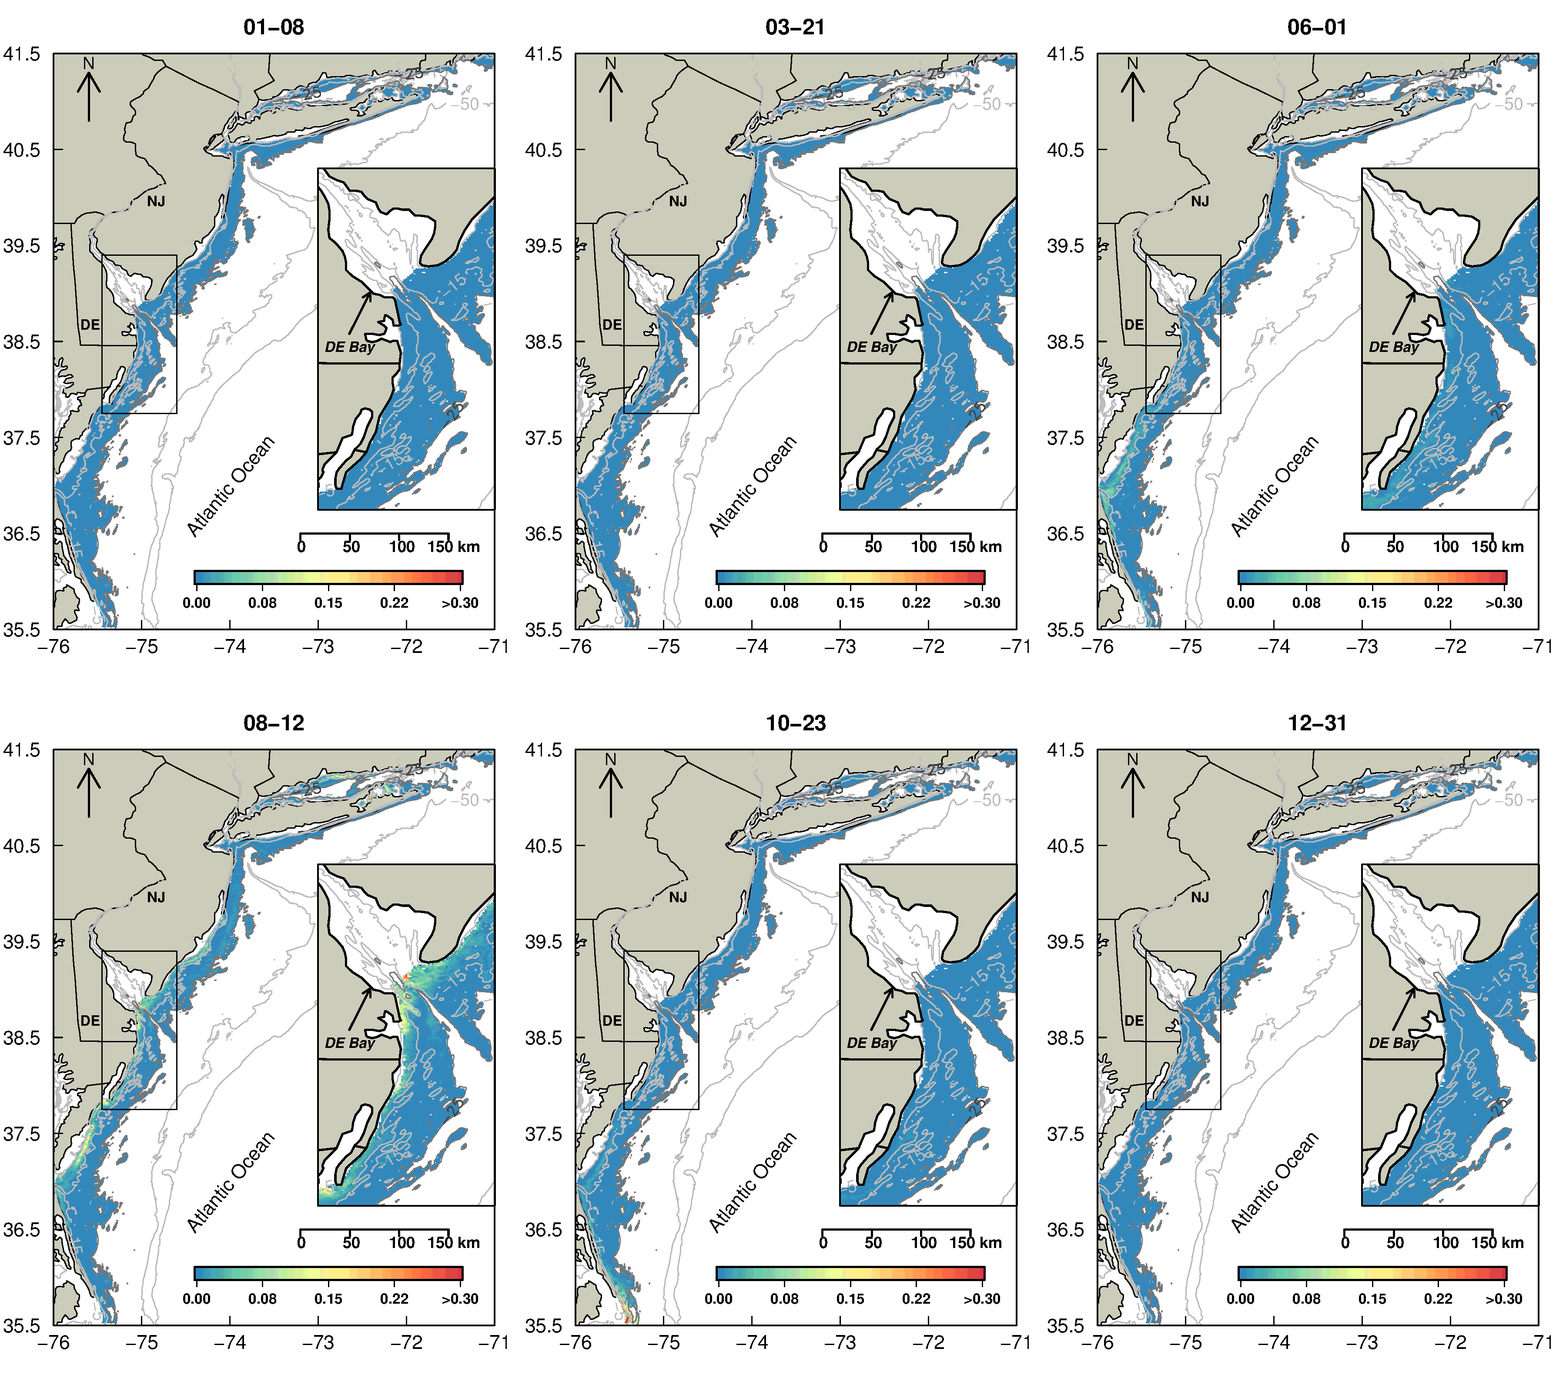
Animation of generalized additive mixed model probability of occurrence predictions (blue = low, red = high) for all Sand Tiger Carcharias taurus occurrence in the coastal ocean study region in the using an 8 day climatology of SST and Rrs555 from the MODIS-aqua satellite record, day of year, and depth as a predictor inputs. Inset map shows predictions within approximate domain of acoustic receiver arrays, where model performance was cross validated. Predictions outside of the inset should be considered preliminary. Dates (mo-d) reflect the first day of each 8 day period for climatological data used for prediction.

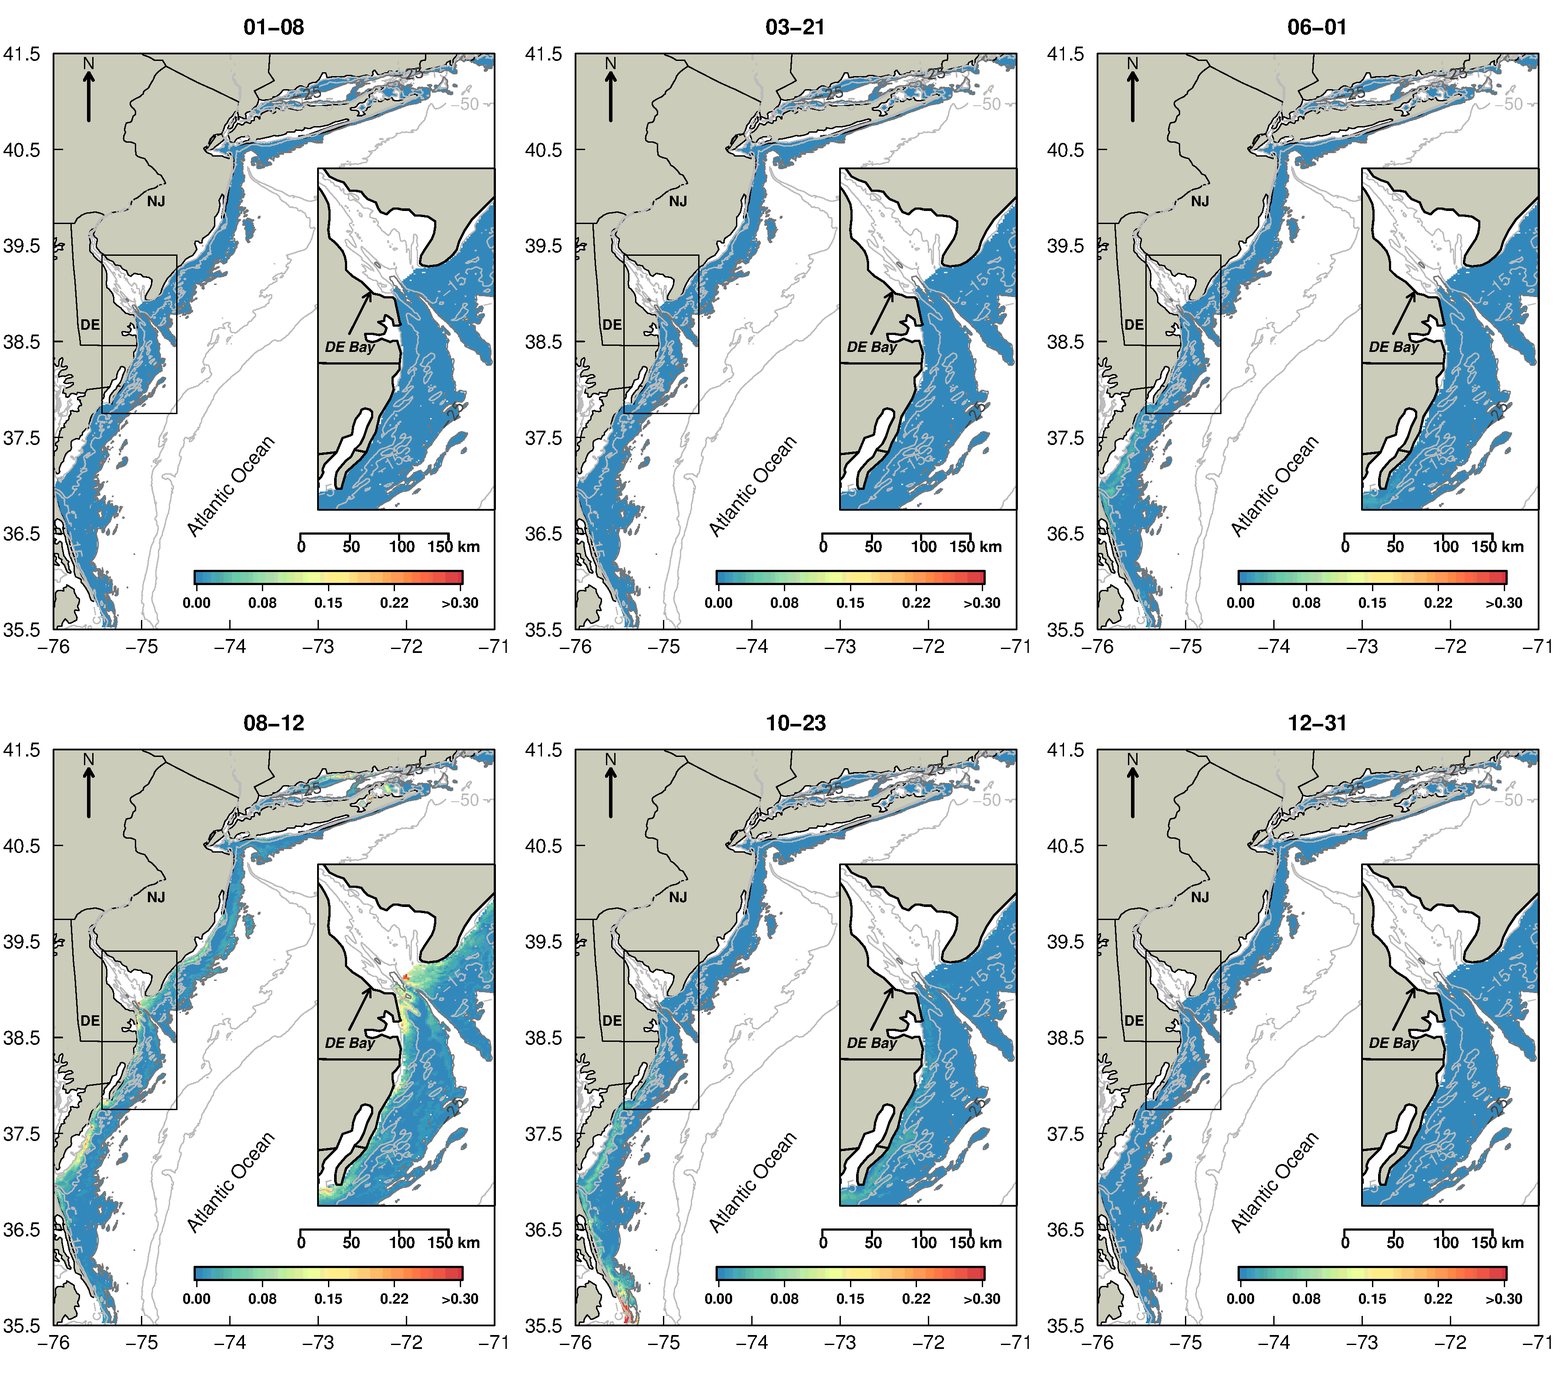
Animation of generalized additive mixed model probability of occurrence predictions (blue = low, red = high) for adult male Sand Tiger Carcharias taurus occurrence in the coastal ocean study region in the using an 8 day climatology of SST and Rrs555 from the MODIS-aqua satellite record, day of year, and depth as a predictor inputs. Inset map shows predictions within approximate domain of acoustic receiver arrays, where model performance was cross validated. Predictions outside of the inset should be considered preliminary. Dates (mo-d) reflect the first day of each 8 day period for climatological data used for prediction.

Animation of generalized additive mixed model probability of occurrence predictions (blue= low, red = high) for adult female Sand Tiger Carcharias taurus occurrence in the coastal ocean study region in the using an 8 day climatology of SST and Rrs555 from the MODIS-aqua satellite record, day of year, and depth as a predictor inputs. Inset map shows predictions within approximate domain of acoustic receiver arrays, where model performance was cross validated. Predictions outside of the inset should be considered preliminary. Dates (mo-d) reflect the first day of each 8 day period for climatological data used for prediction.

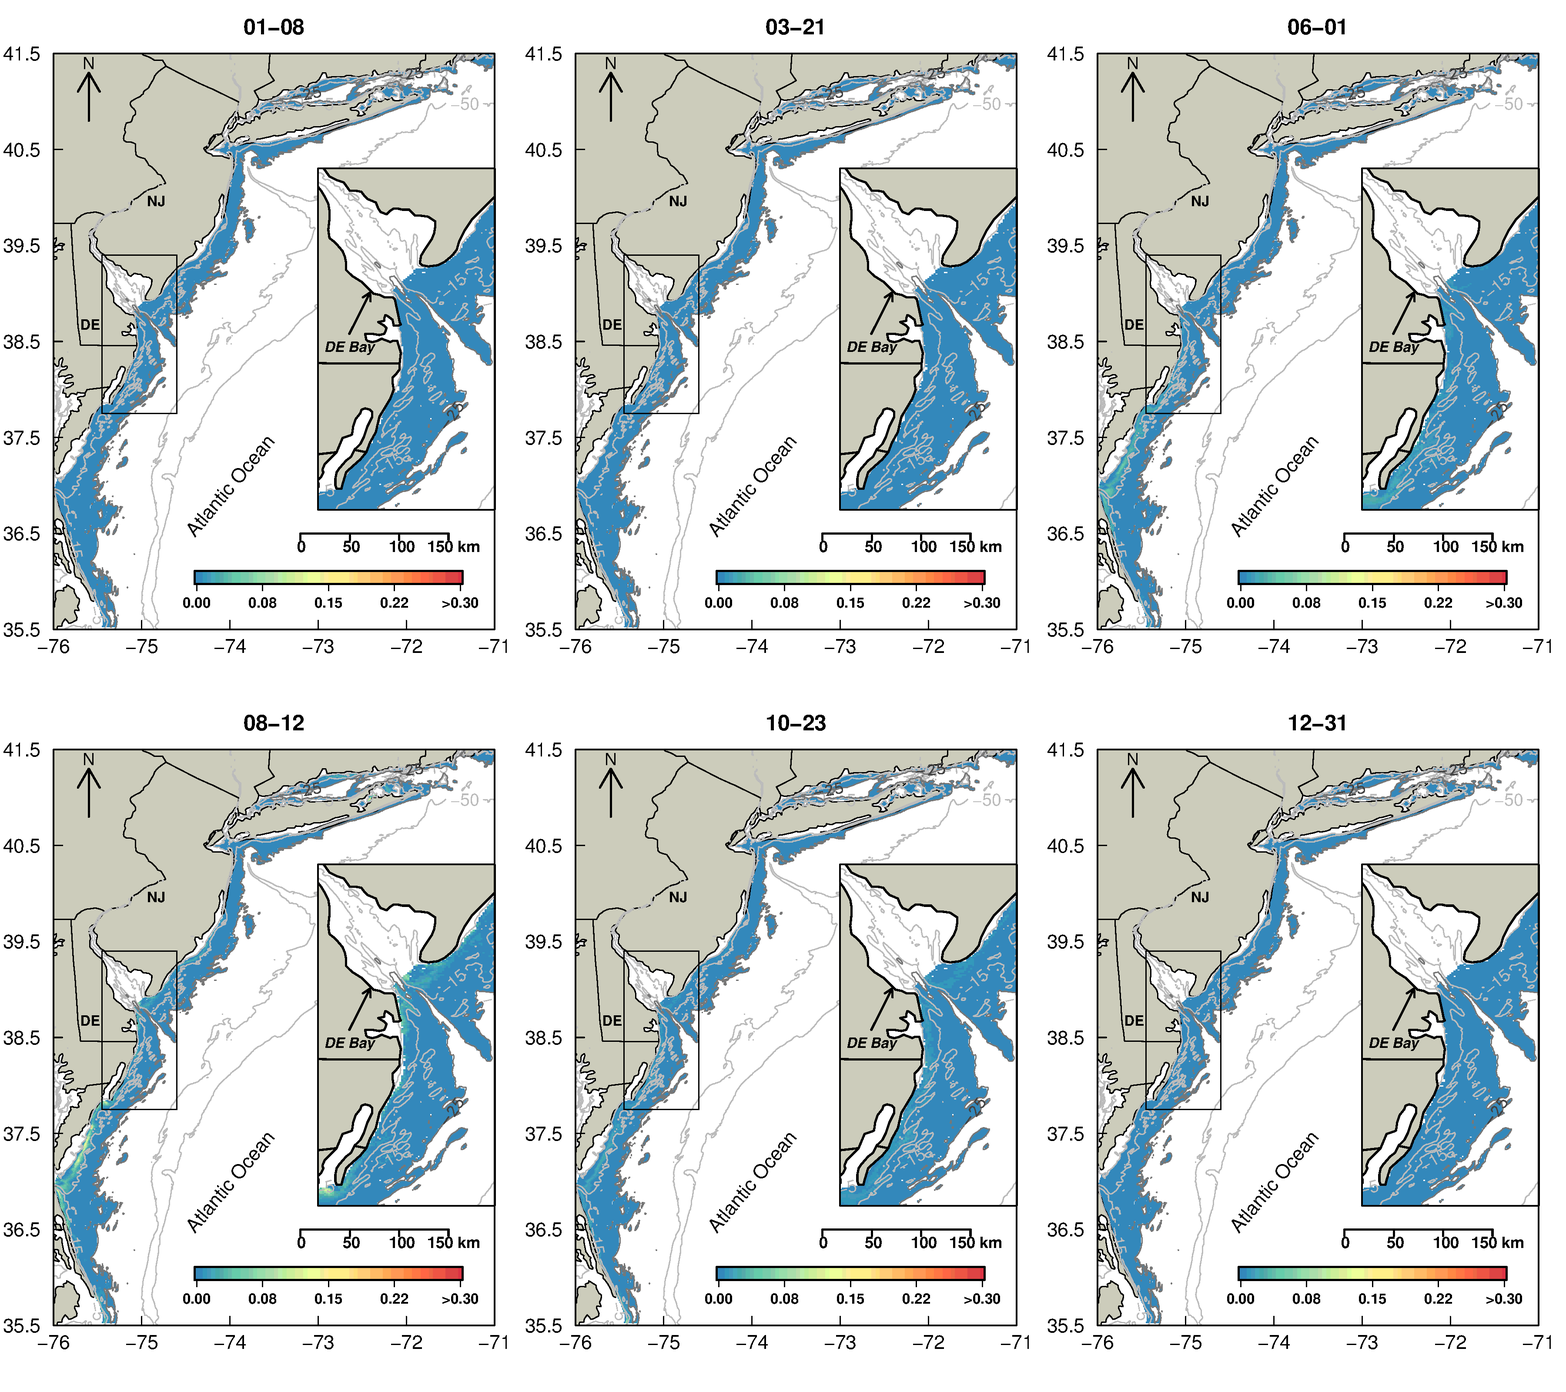
Animation of generalized additive mixed model probability of occurrence predictions (blue = low, red = high) for juvenile Sand Tiger Carcharias taurus occurrence in the coastal ocean study region in the using an 8 day climatology of SST and Rrs555 from the MODIS-aqua satellite record, day of year, and depth as a predictor inputs. Inset map shows predictions within approximate domain of acoustic receiver arrays, where model performance was cross validated. Predictions outside of the inset should be considered preliminary. Dates (mo-d) reflect the first day of each 8 day period for climatological data used for prediction.

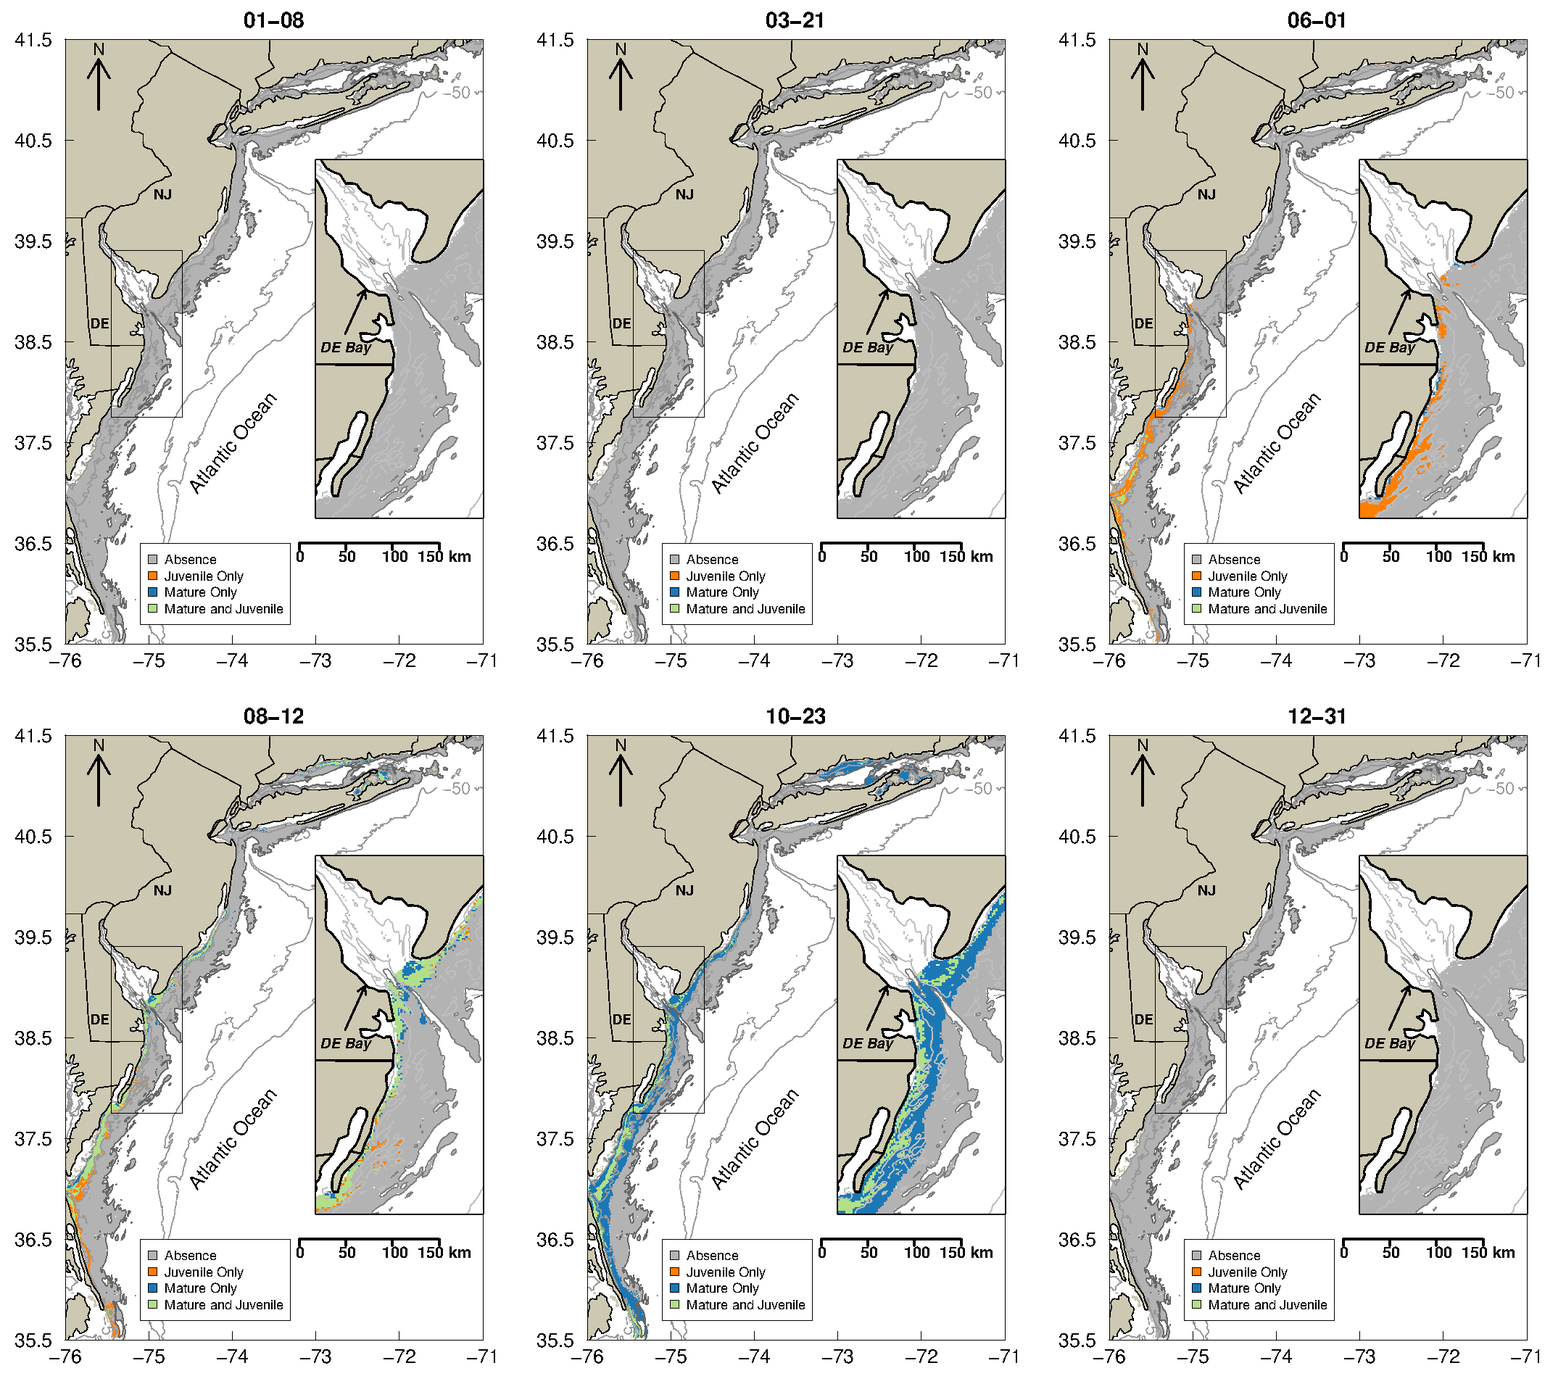
Animation of overlap of life history stages for Sand Tiger Carcharias taurus occurrence predicted by generalized additive mixed models in the coastal ocean study region using an 8 day climatology of SST and Rrs555 from the MODIS-aqua satellite record, day of year, and depth as a predictor inputs. Dates (mo-d) above each panel reflect the first day of each 8 day period for climatological data used for prediction.
