MEPS 646:1-12 Supplementary Material
Tracking the marine migration routes of South Pacific silver eels
MEPS 646:1-12 | Full text in pdf format

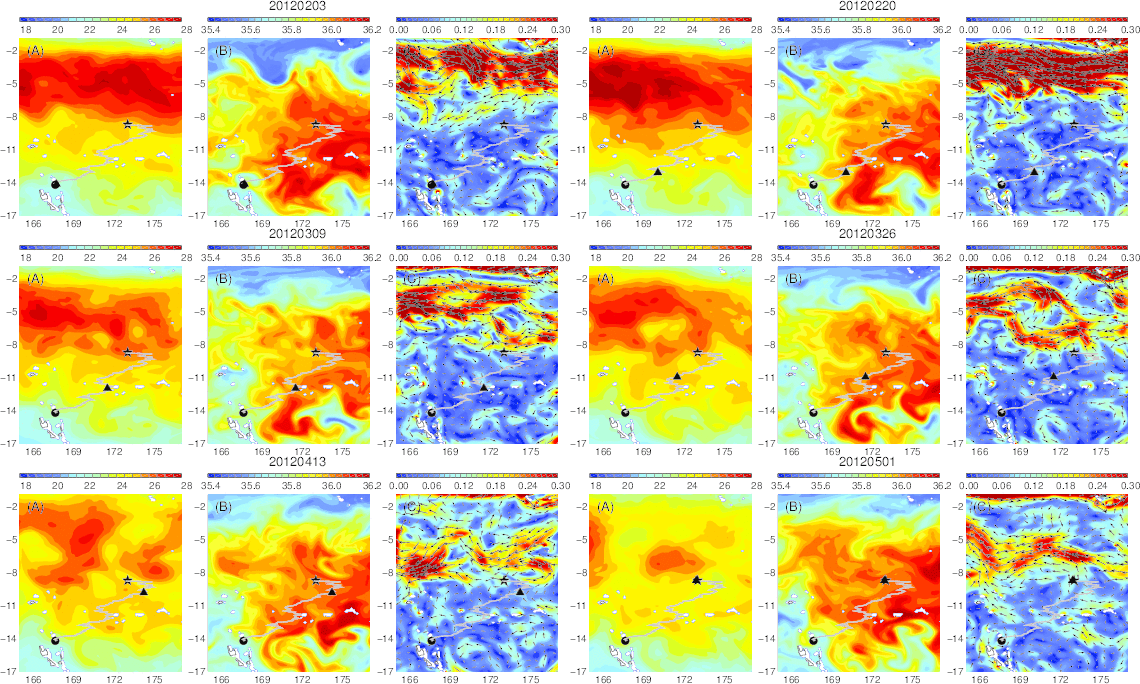
Variability of the temperature (A), salinity (B), and current field (C) at the median nighttime depth (± robust standard deviation, 174 ± 30 m) of Eel 1 (Anguilla marmorata) during its migration in the western South Pacific. The black circle and star are the departure and pop-up locations, respectively, and the triangle represents the position of the eel along its estimated migration route at each time step.
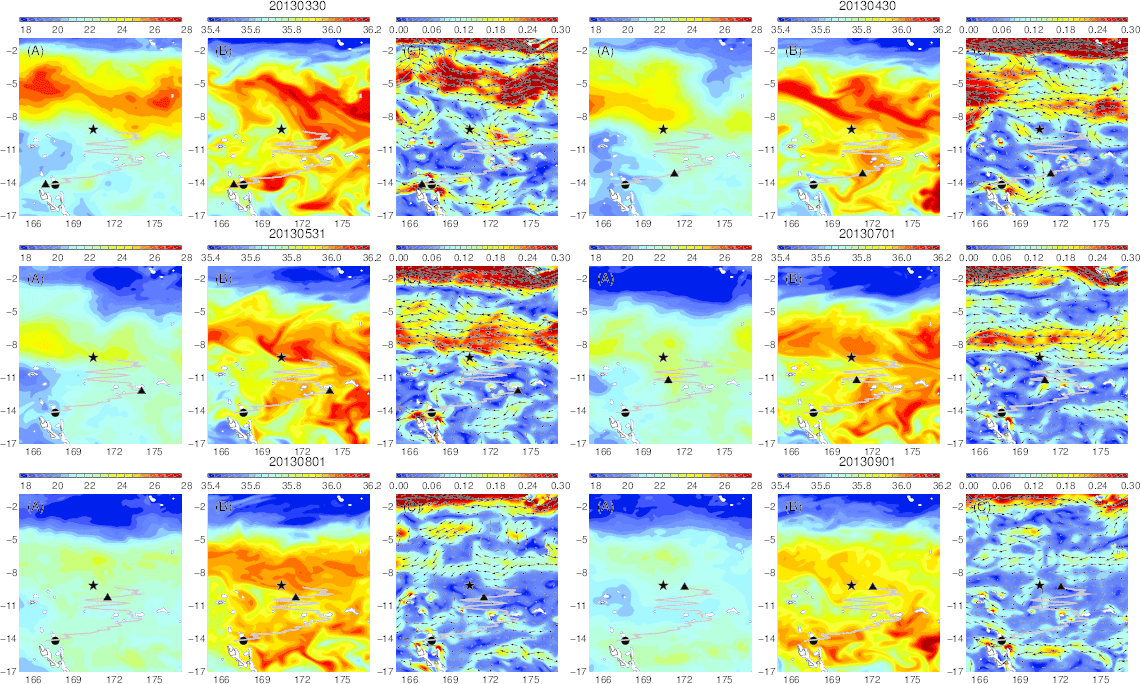
Variability of temperature (A), salinity (B), and current field (C) at the median nighttime depth (± robust standard deviation, 188 ± 45 m) of Eel 2 (Anguilla marmorata) during its migration in the western South Pacific. Further details: see Anim. S1.
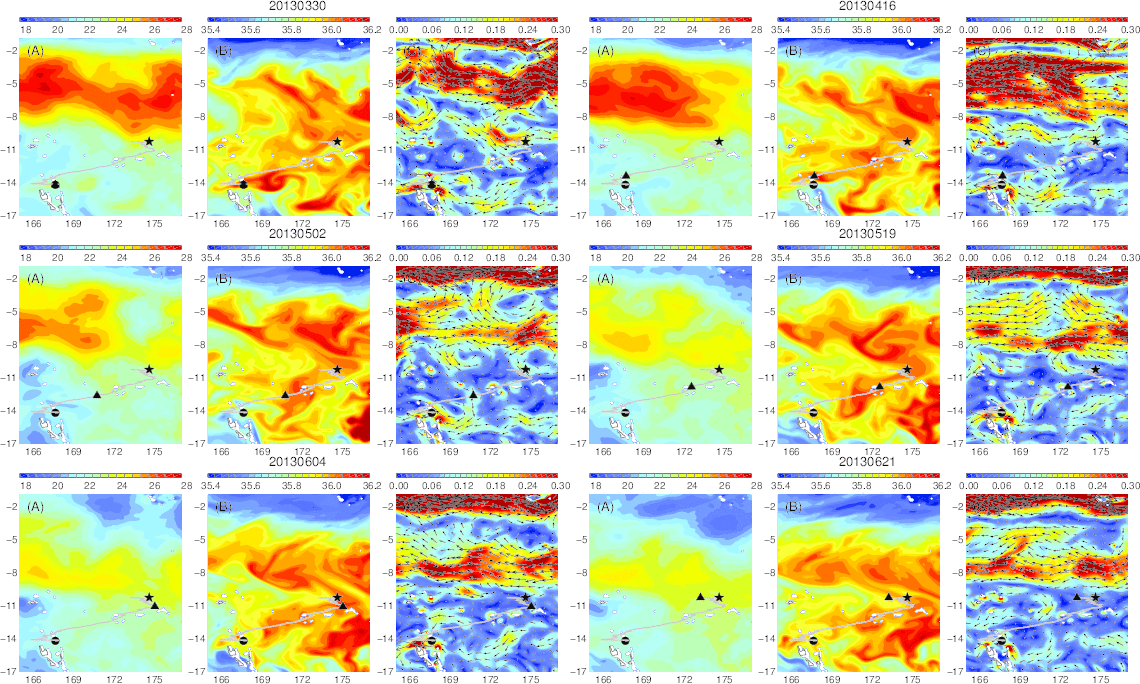
Variability of temperature (A), salinity (B), and current field (C) at the median nighttime depth (± robust standard deviation, 177 ± 21 m) of Eel 3 (Anguilla megastoma) during its migration in the western South Pacific. Further details: see Anim. S1.
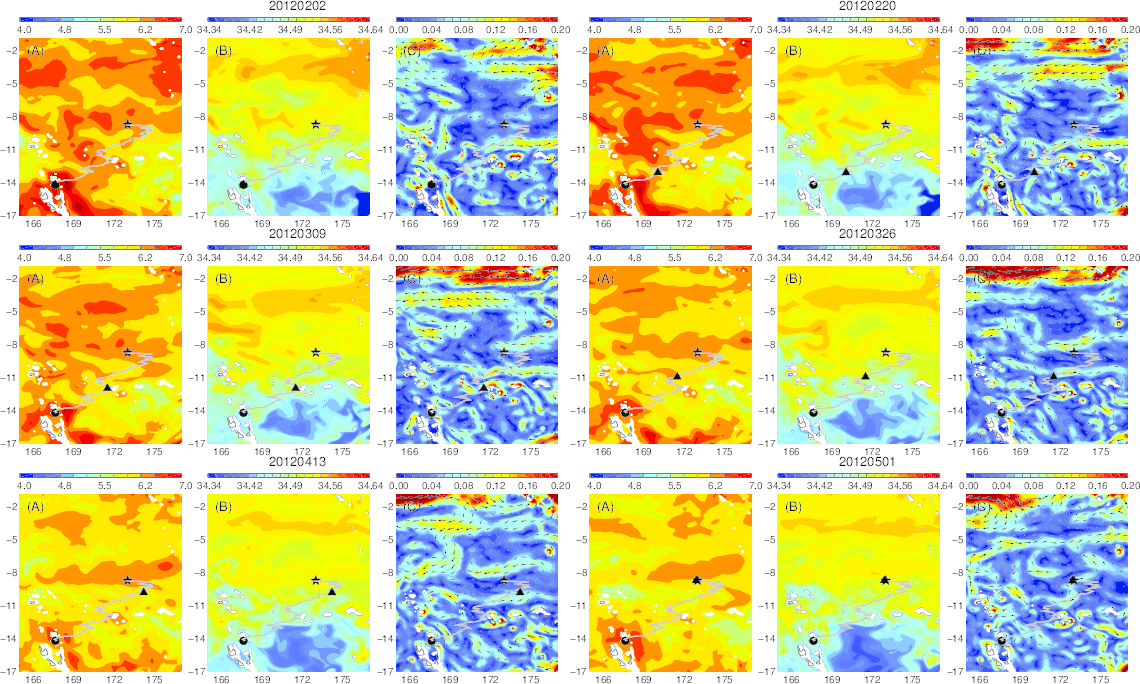
Variability of temperature (A), salinity (B), and current field (C) at the median daytime depth (± robust standard deviation, 653 ± 21 m) of Eel 1 (Anguilla marmorata) during its migration in the western South Pacific. Further details: see Anim. S1.
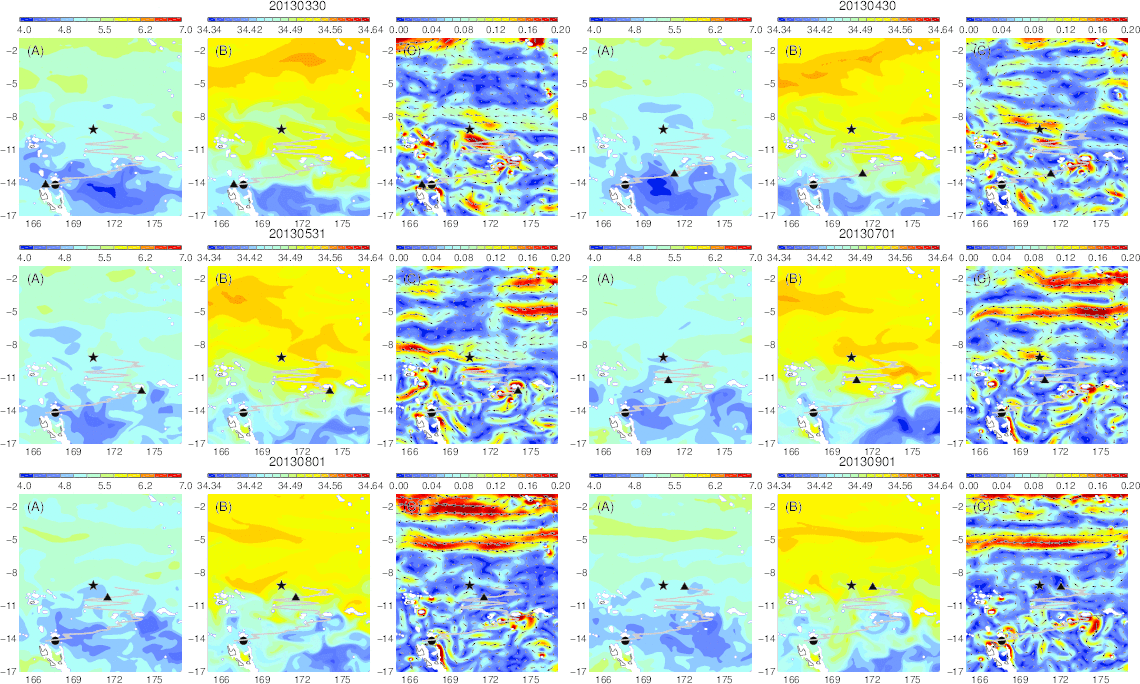
Variability of temperature (A), salinity (B), and current field (C) at the median daytime depth (± robust standard deviation, 806 ± 30 m) of Eel 2 (Anguilla marmorata) during its migration in the western South Pacific. Further details: see Anim. S1.
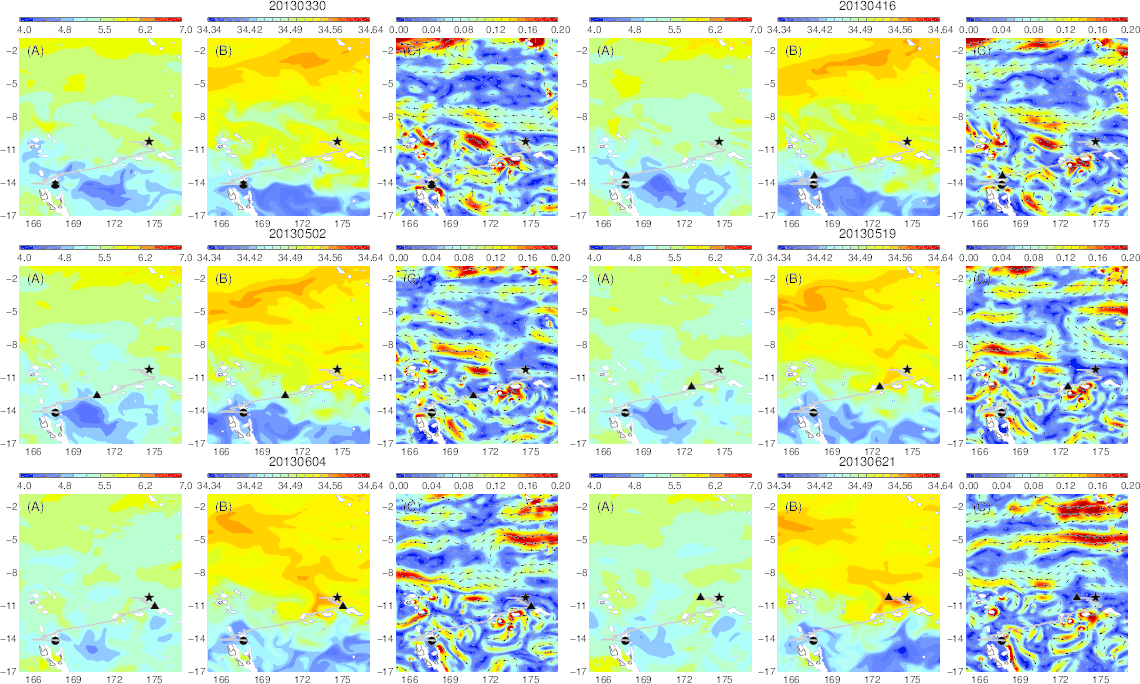
Variability of temperature (A), salinity (B), and current field (C) at the median daytime depth (± robust standard deviation, 758 ± 21 m) of Eel 3 (Anguilla megastoma) during its migration in the western South Pacific. Further details: see Anim. S1